Product Sales Reports
Understanding where your revenue comes from -- and which products are performing best -- is key to running your club effectively. Clubspot’s revenue reports and Product Mix report provide insight into sales trends and item performance. This article walks through how to use these tools.
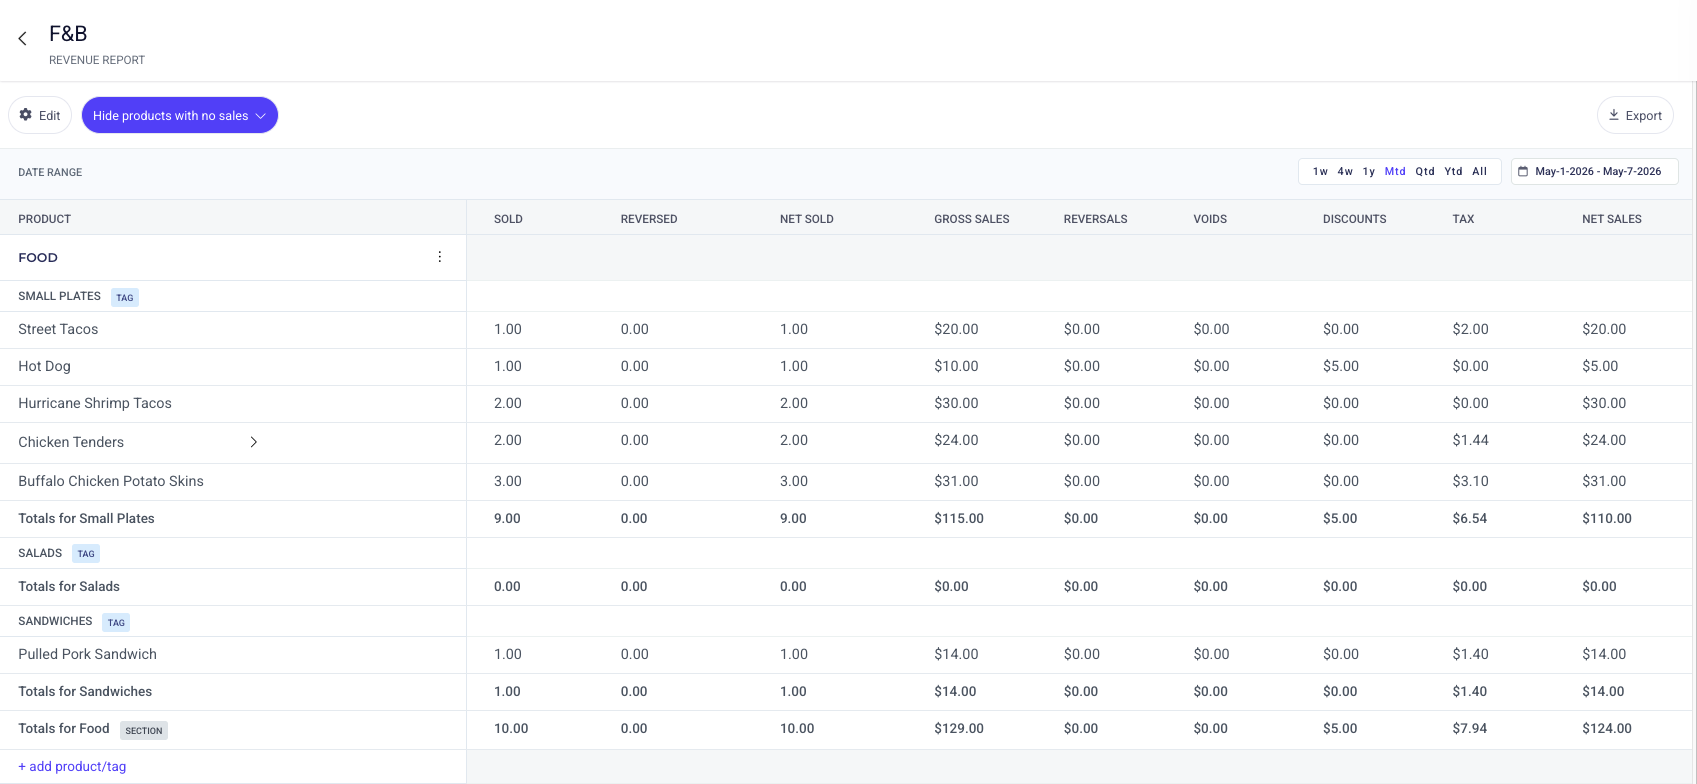
Revenue Report
Revenue reports are a powerful way to compare sales across all items at your club and identify trends in product performance. These reports can also be customized to focus on specific items, item tags, or custom groups, giving you flexibility in how you analyze your data.
It’s important to note that revenue reports are designed for operational insights, not financial reporting. For example, if a product is deleted from your item library, it will no longer appear in these reports, meaning they may not reflect a complete historical view of revenue.
View or edit a report
In the Clubspot dashboard, navigate to Reporting > Revenue reports. This view shows a list of all revenue reports created by administrators at your club.
Click on a report to view or edit it. You can edit the report by adding new sections or products. You can also change the date range and view report data.
Note that you can filter out products without any sales to produce a more concise report for both preset and custom reports.
Create a new report
Click the + Report button in the upper right corner under Reporting > Revenue reports.
Enter a name and description for your report. Clubspot will create a new report for you, and drop you on the report details view to start adding Sections and Products.
Add at least one Section. Sections help organize your report. Common examples of section headers are Appetizers on a F&B report, or Apparel on a merchandise report.
Add any number of products to each section.
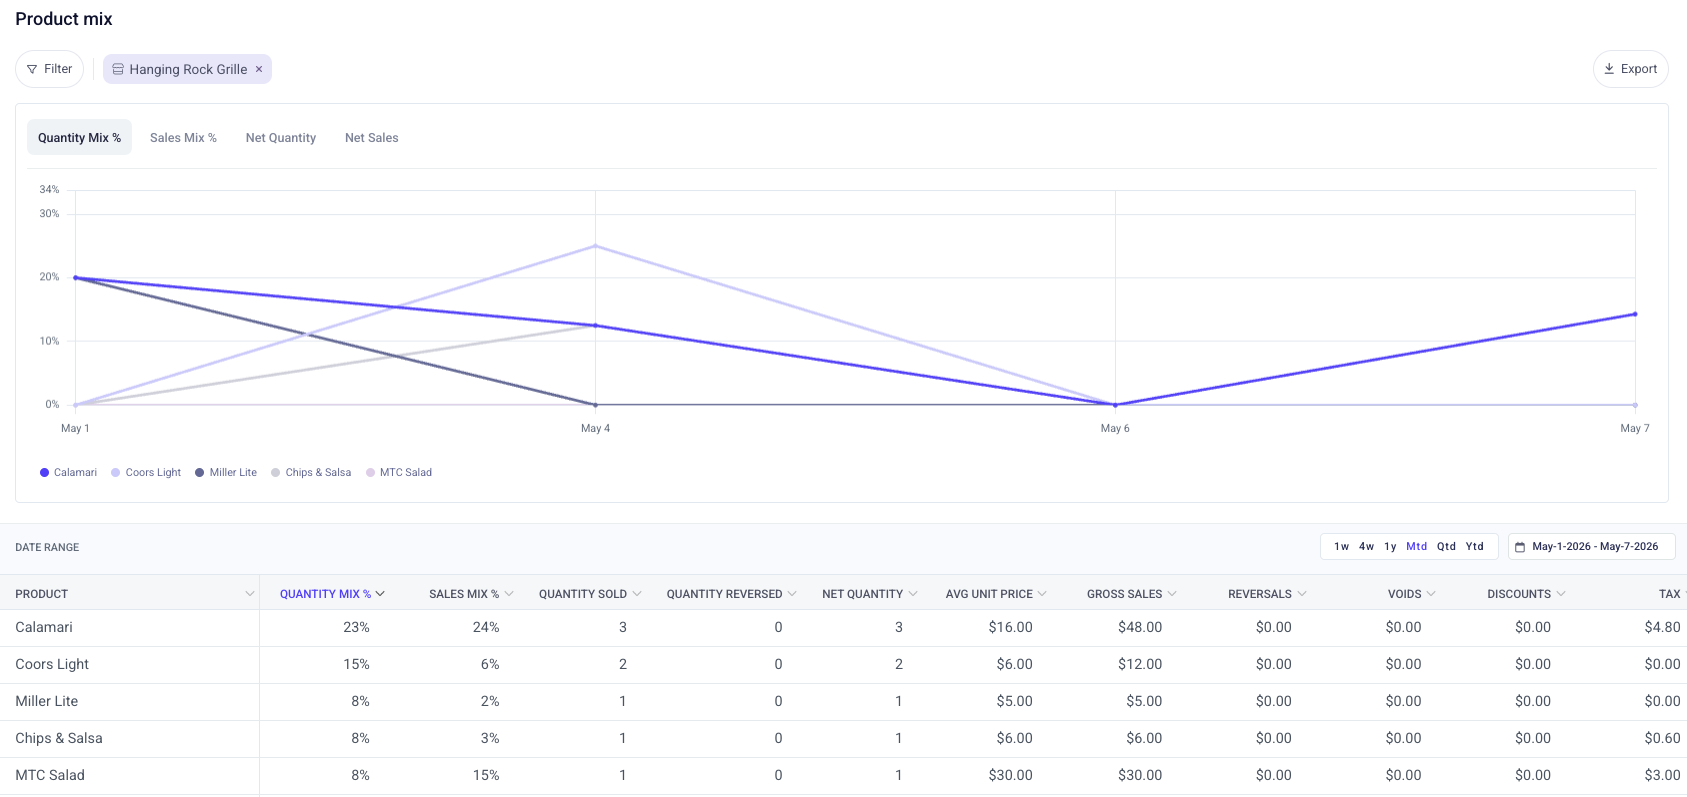
Product Mix
The Product Mix (Pmix) report is especially useful for analyzing individual item performance, such as quantity sold and sales mix, specifically in the context of Point of Sale activity. You can access this report under Point of Sale > Product mix in your dashboard.
Here you can apply filters, custom date ranges, and see the breakdown of item performance based on the quantity and dollar amount sold.